iOS Diagnostics

Update - There is some new information in this post relating to iOS 8. The instructions below for obtaining the data dump are still valid.

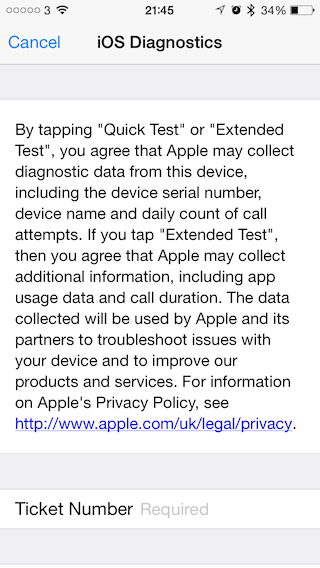
I’ve recently been having a play with the iOS Diagnostics tool. It turns out that this tool can provide you with a treasure trove of information about your device. From which accessories you have connected, to extremely detailed power usage information. You can get to it by entering the URL diags:// into Safari. You’ll be greeted with a screen asking you for a ticket number:

Screenshot

Where do you get a ticket number from? You could go to the genius bar, but there is an easier way. We can use a a man-in-the-middle proxy and spoof iOS Diagnostics into thinking it has a valid ticket. I decided to use mitmproxy as it supports https and can be scripted. I’ve made a mitmproxy script that you can use to spoof iOS Diagnostics and capture the payload that would be sent to Apple. So let’s being.

When started iOS Diagnostics makes a request to https://iosdiags.apple.com/ios/TestConfiguration/1.2 to find out what diagnostics are available for your device. The response is a plist containing a dictionary keyed on device type mapping to an array of diagnostic types. The only value I’ve seen is powerDiagnostics. A quick poke around in the binary seems to confirm this is the only accepted value at the moment. If your device type matches you’ll be offered ‘Extended Tests’. Currently Apple only seems to offer this for iPhones and not iPads. However, I’ve been able to get extended diagnostics from an iPad too. You’ll need to edit XML_OK_RESPONSE to include your device type, if you want the more detailed power logs.

If you now enter a ticket number - the script expects 123456 - and press Extended Tests, iOS Diagnostics will make a request to https://iosdiags.apple.com/MR3Server/ValidateTicket?ticket_number=123456. If you don’t have a valid ticket Apple will politely respond with a not authorised 401. Our script is going to responsd with a 200 and the same body we used before. It appears as though any positive response is good. Next comes the good stuff. iOS Diagnostics will now perform two uploads. First to https://iosdiags.apple.com/MR3Server/MR3Post and then, if you choose extended test, to https://iosdiags.apple.com/ios/log/extendedUpload.

To get started download and install mitmproxy and download the script here. As iOS diagnostics uses https you’ll need to install the mitmproxy CA on your device. You can find instructions here. You can start the command line version of mitmproxy - mitmdump - like so:

1
mitmdump -e -s capture.py 

You’ll then need to set your proxy in the wifi settings on your iOS device to the IP address of your machine running the proxy. The default port is 8080. Once you’re all configured go to Safari and go to diags:// Enter 123456 as the ticket number and select Extended Tests. After a short time you’ll be left with two tar.gz files containing all the good stuff.

The smaller file starting with ‘general’ contains logs relating to iCloud backups, memory and accessories. The accessory logs are in the iAPEvents directory. You’ll need to load them into Console to view them. It looks like each time a device is connected (even those connected over Bluetooth LE) an entry is written. For example:

1
2
3
4
5
6
7
Jan  9 21:35:30 Ishras-iPhone-5S iapd[149] <Warning>: AccessoryInfo = {
Jan  9 21:35:30 Ishras-iPhone-5S iapd[149] <Warning>:     IAPAppAccessoryNameKey = Apple Digital AV Adapter;
Jan  9 21:35:30 Ishras-iPhone-5S iapd[149] <Warning>:     IAPAppAccessoryManufacturerKey = Apple;
Jan  9 21:35:30 Ishras-iPhone-5S iapd[149] <Warning>:     IAPAppAccessoryModelNumberKey = A1438;
Jan  9 21:35:30 Ishras-iPhone-5S iapd[149] <Warning>:     IAPAppAccessoryFirmwareRevisionKey = 7.0.0 (11A7451);
Jan  9 21:35:30 Ishras-iPhone-5S iapd[149] <Warning>:     IAPAppAccessoryHardwareRevisionKey = 1.0.0;
Jan  9 21:35:30 Ishras-iPhone-5S iapd[149] <Warning>: } // End AccessoryInfo

The larger file starting with ‘power’ contains all the power logs. It’s a compressed CPIO file containing a set of compressed text files. There is one file for each day. I found over two weeks of files on my device. Each file is very detailed and on my iPhone 5s about 16mb a day. If you look inside you’ll see lots of entries, each prefixed with a time and type. Most of if is pretty clear, here are some examples:

1
2
3
4
02/01/14 00:00:03 [Display] active=yes; brightness=46.5%; user_brightness=<unknown>; lux=5; als=enabled; mie=off; slider=30480; mNits=142559; uAmps=5028;
02/01/14 00:00:03 [BasebandLoggingConfig] Artemis=null(null); Boot=null(null); CSILog=false(-1); CoreDump=null(null); DIAG=false(256); EURCoreDump=1(); MobileAnalyzer=null(null); Mux=null(null); USBDump=null(null); USBTracerDump=null(null);
02/01/14 00:00:19 [Battery] level=62.67%; voltage=3914 mV; current=-200 mA; current_capacity=925 mAh; raw_max_capacity=1476 mAh; charging_state=Inactive; charging_current=0 mA; battery_temp=32.50 C; adapter_info=0; connected_status=0;
02/01/14 00:02:04 [Telephony] current_rat=Automatic; preferred_rat=Automatic; camped_rat=UMTS; call_status=Inactive; airplane_mode=off; signal=-104 dBm; bars=2;

As well as power information there is periodic logging of the process table and network statistics. This includes how much time each process has used and how much cellular and wifi data has been used on a per process level:

1
2
3
4
5
02/01/14 00:03:21 [ProcessMonitor] backboardd(31)=555.90s; kernel_task(0)=240.84s; SpringBoard(16)=142.11s; locationd(60)=96.31s; CommCenter(59)=80.51s; aggregated(70)=56.25s; Tweetbot(391)=51.99s; MobileSafari(399)=51.14s; UserEventAgent(15)=29.76s; mediaserverd(29)=24.99s; assetsd(122)=23.74s; WhatsApp(152)=21.93s; MobileSMS(170)=21.53s; wifid(40)=14.15s; networkd(83)=13.57s; configd(42)=13.09s; imagent(23)=10.84s; kbd(118)=10.60s; securityd(84)=10.30s; syslogd(38)=9.88s; Shazam(238)=9.79s; apsd(87)=9.57s; identityservice(53)=9.18s; DuetLST(97)=5.86s; launchd(1)=5.82s; powerd(54)=5.47s; BTServer(48)=5.36s; MobileMail(120)=5.36s; ReadItLaterPro(162)=5.25s; notifyd(73)=4.60s; dataaccessd(109)=3.71s; IMDPersistenceA(81)=3.52s; librariand(111)=3.30s; ubd(52)=3.30s; mDNSResponder(51)=2.97s; itunesstored(95)=2.91s; iapd(144)=2.76s; MobileSlideShow(294)=2.74s; accountsd(86)=2.45s; FindMyFriends(164)=2.45s; iaptransportd(55)=2.42s; fseventsd(19)=2.33s; PebbleApp(357)=1.43s; geod(112)=1.38s; sharingd(21)=1.26s; biometrickitd(108)=1.26s; Offlinemail(379)=1.20s; netatmo(269)=1.16s; National Rail(314)=1.13s; MobileCal(134)=0.99s; BTLEServer(101)=0.97s; assistantd(71)=0.96s; mobileassetd(99)=0.95s; softwareupdates(121)=0.87s; Preferences(367)=0.87s; keybagd(64)=0.85s; routined(33)=0.85s; wirelessproxd(35)=0.84s; fairplayd.H2(44)=0.78s; itunescloudd(94)=0.71s; mediaremoted(65)=0.68s; installd(17)=0.65s; lockdownd(25)=0.61s; SiriViewService(362)=0.51s; aosnotifyd(22)=0.46s; calaccessd(135)=0.42s; medialibraryd(96)=0.37s; timed(37)=0.34s; softwarebehavio(28)=0.32s; filecoordinatio(124)=0.30s; WirelessCoexMan(80)=0.29s; lsd(77)=0.29s; tccd(110)=0.29s; recentsd(176)=0.29s; AGXCompilerServ(395)=0.28s; nsnetworkd(106)=0.28s; AppleIDAuthAgen(32)=0.21s; xpcd(76)=0.20s; touchsetupd(117)=0.20s; AGXCompilerServ(114)=0.19s; AGXCompilerServ(400)=0.17s; MobileGestaltHe(75)=0.16s; storebookkeeper(92)=0.09s; CloudKeychainPr(128)=0.09s; adid(126)=0.09s; BTAvrcp(147)=0.08s; networkd_privil(85)=0.08s; BlueTool(79)=0.06s; assistant_servi(364)=0.06s; notification_pr(388)=0.05s; CMFSyncAgent(98)=0.04s; sandboxd(72)=0.04s; distnoted(78)=0.04s; vmd(20)=0.04s; com.apple.Mobil(102)=0.03s; EscrowSecurityA(103)=0.03s; xpcd(113)=0.02s; oscard(104)=0.02s; softwareupdated(67)=0.01s;

02/01/14 00:03:21 [Network Connections Symptoms] procName=timed; bundleName=<unknown>; wifi-in=1216bytes; wifi-out=1216bytes; cell-in=0bytes; cell-out=0bytes; sinceTime=09/25/13 09:35:16;
02/01/14 00:03:21 [Network Connections Symptoms] procName=assetsd; bundleName=<unknown>; wifi-in=2524167bytes; wifi-out=663731bytes; cell-in=4018850bytes; cell-out=1112680bytes; sinceTime=09/26/13 23:35:59;
02/01/14 00:03:21 [Network Connections Symptoms] procName=Flipboard; bundleName=com.flipboard.flipboard-ipad; wifi-in=50671132bytes; wifi-out=1055416bytes; cell-in=23766010bytes; cell-out=529125bytes; sinceTime=10/08/13 16:03:23;

You can see when background processes wake up the device:

1
02/01/14 00:06:06 [Application] id=com.apple.mobileme.fmf1; pid=164.00; mode=Background Running; reason=backgroundContentFetching; UIBackgroundModes=fetch; display_name=Find Friends; executable=FindMyFriends; version=3.0;

and when applications are running in the foreground:

1
02/01/14 00:14:21 [Application] id=com.apple.mobilesafari; pid=399.00; mode=Foreground Running; reason=<unknown>; UIBackgroundModes=audio,continuousFallback; display_name=Safari; executable=MobileSafari; version=7.0;

It’s all interesting stuff. Hopefully I’ll get some time to write scripts to extract graphs from the logs. So next time you have one of those days where the battery lasts no time, take a look in the logs and you’ll probably be able to find the culprit!

Update (14/2/14)

The link to the script is now fixed. Sorry about that.

Remember, you’ll only get Quick Test unless your device is included in XML_OK_RESPONSE. You can get a complete list here.


Comments


Copyright © 2014 - Christopher Lyon Anderson. Powered by Octopress